Research Article | | Peer-Reviewed

The Impact of Climate Change on Food Accessibility in Egypt: An Empirical Analysis of Prevalence of Undernourishment

Received: 28 June 2026     Accepted: 14 July 2026     Published: 9 September 2026
Views:       Downloads:
Abstract

Climate change is negatively affecting food systems as a whole, as weather events are becoming more frequent and severe, which will pose a challenge to food production and may threaten the world’s people's ability to access and afford healthy diets, particularly in lower-income countries with higher rates of hunger and poverty. Inadequate diets will exacerbate the harm caused to people’s health and lead to higher rates of malnutrition among the population. In this study, we aim to examine the impact of climate change on food accessibility in Egypt over the period 2001–2023. We adopted the autoregressive distributed lag (ARDL) approach to trace long-run and short-run effects. The empirical results indicate a significant negative effect of climate change on food access, with temperature having a positive effect on the prevalence of malnutrition—as temperature-related shocks negatively affect food supply and lead to higher domestic food prices, which in turn limit people’s ability to purchase healthy and adequate food, thereby increasing malnutrition rates among the population. Food price inflation negatively impacts access to food, as these sharp price increases lead to a contraction in real income and higher rates of malnutrition during climate shocks. With regard to gross domestic product per capita and its positive impact on access to food, this demonstrates that purchasing power and income act as fundamental structural buffers protecting Egyptians households from sharp rises in food price inflation. As for per capita food production, this has a negative impact on malnutrition rates.

Published in International Journal of Nutrition and Food Sciences (Volume 15, Issue 5)
DOI 10.11648/j.ijnfs.20261505.11
Page(s) 178-190
Creative Commons

This is an Open Access article, distributed under the terms of the Creative Commons Attribution 4.0 International License (http://creativecommons.org/licenses/by/4.0/), which permits unrestricted use, distribution and reproduction in any medium or format, provided the original work is properly cited.

Copyright

Copyright © The Author(s), 2026. Published by Science Publishing Group

Keywords

Climate Change, Food Accessibility, Prevalence of Under-nourishment, ARDL, Egypt

1. Introduction
Despite sufficient global food production, millions of people struggle with hunger or undernutrition due to a lack of safe and nutritious food, difficulty accessing it, or, in most cases, an inability to afford it. This situation threatens not only the fulfilment of Sustainable Development Goal 2 (SDG 2) and global nutrition targets, but also the 2030 Agenda for Sustainable Development as a whole, by undermine people's health and livelihoods , with the global prevalence of malnutrition remaining virtually unchanged for three consecutive years, following the sharp increase driven by the COVID-19 pandemic. According to the Food and Agriculture Organisation’s 2024 report, around 713 to 757 million people suffered from hunger in 2023 — that is, one out of every 11 people globally, and one out of every five people in Africa. It is estimated that 28.9 percent of the world’s population, corresponding to 2.33 billion people, suffered from mild or severe food insecurity. Focusing on the economic ability to access nutritious food, updated and refined estimations reveal that more than a third of the world’s population — around 2.8 billion people — were unable to afford a healthy diet in 2022. The disparities are clear: Lower-income countries have the highest proportion of people unaffordable a healthy diet (71.5 percent), compared with lower-middle-income countries (52.6 percent), upper-middle-income countries (21.5 percent) and high-income countries (6.3 percent). An anticipated 582 million people are expected to suffer from severe chronic malnutrition by the end of 2030, more than half of them in Africa .
Climate variability is no longer an isolated environmental phenomenon; it has become a risk multiplier and the primary driver of structural deficiencies in global food systems. In its sixth assessment report, the Intergovernmental Panel on Climate Change (IPCC) confirmed that the Earth’s surface temperature has increased by 1.1 degrees Celsius above pre-industrial levels, at the fastest rate of warming in since 2,000 years, with nearly 3.3 to 3.6 billion people now live in extremely vulnerable areas exposed to direct environmental risks, confirms that global warming, the increasingly frequent of extreme temperatures, fluctuating precipitation patterns, and repeated droughts and floods have all contributed to a significant slowed in global agricultural productivity over past 50 years . The climate-related impacts are not limited to supply and availability alone but are directly reflected in local food prices; as empirical studies indicate that any increase in the severity of heat shocks leads to sudden supply shocks, which in turn drive up food price inflation and put pressure on households’ real incomes, pushing prevalence of undernutrition rates upward.
Climate change or extreme weather events are likely to affect the availability of certain food products, which in turn could affect their prices. High prices will make certain foods unaffordable, and rising food prices also affect real income; low-income households are often the hardest hit, as they tend to allocate a larger proportion of their income to food than high-income households . When households are unable to afford food, they adapt by reducing their consumption of higher-quality foods or switching to lower-quality alternatives, which may affect people’s nutrition and lead to rising rates of malnutrition. The main impact of climate change on nutrition is likely to be indirect, through its effects on income and the ability to afford a varied diet.
Furthermore, climate impacts on agriculture also lead to a decline in demand for seasonal labour, thereby reducing household incomes. When crops fail, employment opportunities in the agricultural sector fall sharply. Whilst commercial farms rely on insurance, smallholder farmers in developing countries lack such protection, leaving them vulnerable to severe income losses during crop failures or market shocks. As a result, they often have no surplus to sell when prices peak .
Egypt is not far from these global shocks; in fact, international reports classify it as one of the country’s most exposure to climate change. Despite accounting for fewer than 1 per cent of global greenhouse gas emissions, Egypt is highly exposed to the adverse risks of climate change. This vulnerability is clearly highlighted in the national communication reports prepared by the Egyptian Environmental Affairs Agency (EEAA) and submitted to the United Nations Framework Convention on Climate Change (UNFCCC) . This issue takes on complex dimensions in Egypt due to the country’s geographic and demographic characteristics; nearly 60% of Egypt’s agricultural food production is concentrated in the Nile Delta, and the Delta region is expected to lose at least 30 per cent of its food production by 2030 . The Delta is classified as one of the three largest ‘giant deltas’ threatened by salinisation, flooding and declining productivity by 2050, due to reduced sediment flow through the rivers, as well as accelerating rates of sea-level rise . The agricultural sector contributes 13.7% of Egypt’s gross domestic product and employs about 18% of the total workforce in 2024 (World Bank Data, 2026), meaning that any disruption in this sector directly affects the income of millions of rural households.
Egypt is classified as the world’s leading importer of wheat. The International Food Policy Research Institute (IFPRI) notes that imports account for more than 40% of Egypt’s total caloric intake, reflecting a significant reliance on foreign markets to secure essential strategic commodities . According to data released by the Food and Agriculture Organization (FAO) for 2024 and 2025 and the USDA, the magnitude of this structural gap is evident: Egypt requires approximately 20 million metric tons of wheat annually, of which only about 9.5 million metric tons are produced domestically, while the country is forced to import the remaining shortfall, which amounted to 14 million tons in 2024, with import pressure expected to continue at approximately 13 million tons for 2025 and 2026 . This structural vulnerability makes the Egyptian economy highly sensitive to two types of global shocks: Climate shocks: where droughts and extreme heat waves in major exporting countries cause a decline in global crop yields and a shortage in global supply. (2) Political turmoil: such as the repercussions of political conflicts—for example, the Russian-Ukrainian war, which immediately sent international food prices soaring. According to a study published by the Economic Research Forum (ERF), the price elasticity of global price shocks passed to local markets in Egypt is very high, reaching 29% of the shock within 6 months and rising to 66% after one year . According to reports from the Information and Decision Support Centre of the Egyptian Cabinet, approximately 84.8% of Egyptian households are now facing financial strain in affording a healthy, balanced diet as a result of this imported inflation . These price increases are eroding real income and weakening households’ purchasing power, thereby limiting their direct financial access to food and explaining the sharp rise in the prevalence of undernutrition in line with external and internal shocks.
Therefore, this study is trying to find an answer to the following problematic question: “to what extent do climate changes affect food Accessibility in Egypt during the period 2001-2023?”. Thus, the main hypothesis of this paper is that climate changes negatively and statistically significantly impact food accessibility in Egypt. Previous and recent studies have recognized the expected risks that Egypt will face due to climate change, and these studies focused mainly on the availability of food, while little attention was paid to studying the impact of climate change on food Accessibility. Therefore, this study will help to address this research gap by estimating the impact of climate change on the Accessibility in Egypt by follows the statistical analysis methods ARDL Approach during the period (2001-2023).
The paper is structured as follows: section 2 provides a The Reality of Climate Change and Food Security in Egypt. Section 3 Theoretical Framework and literature review related to the topic. Section 4 details the econometric specification, Data and Methodology. Section 5 discusses the empirical Results and discussion and section 6 conclusion.
2. The Reality of Climate Change and Food Security in Egypt
The issue of access to food and the cost of food continues to place a burden on low-income Egyptian households, as Climate change affects the ability of certain parts of the population to afford sufficient quantities of healthy food families are forced to adjust their dietary choices to align with their limited income and rising food prices ; Food prices have risen significantly in Egypt, leading to an increase in expenditure on food as a share of overall expenditure, from around 34.4% of personal income in 2015 to more than 37% in 2018 to 43% in 2020, and food prices are expected to rise by 16% to 68% in 2030 . People are also forced to rely on cheaper foods and reducing the size of their daily meals by 41%, and reducing daily consumption of foods with high nutritional value by 72%. This shift in the existing diet leads to a further deterioration in individuals’ nutritional status .
Source: FAOSTAT Database (Food and Agriculture Organization) (FAO): https://www.fao.org/faostat/en/#data/FS

Download: Download full-size image

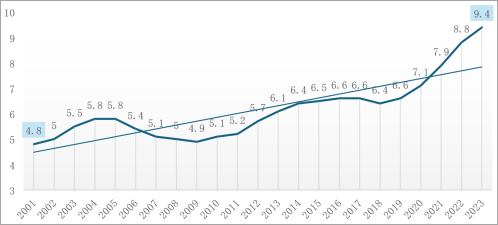
Figure 1. Prevalence of undernourishment (% of population).
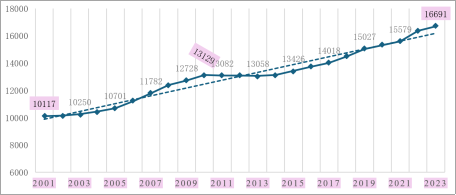
Figure 1 shows the prevalence of undernutrition as a percentage of the population in Egypt. Over the past two decades, a gradual rise in the prevalence rate has been observed, increasing from 4.8% in the period 2001 to 9.4% in the period 2023, a rise of 4.6%. It is also noted that the rate remained relatively stable between 2001 and 2010, ranging between 4.8% and 5.8. however, since 2011, there has been a marked increase in the prevalence of undernutrition. This trend reflects a relative decline in the ability to meet the population’s nutritional needs and may be linked to several economic factors, including rising global food prices and a decline in real per capita GDP.
Source: FAOSTAT Database (Food and Agriculture Organization) (FAO): https://www.fao.org/faostat/en/#data/FS

Download: Download full-size image

Figure 2. Gross domestic product per capita, PPP, (constant 2021 international $).
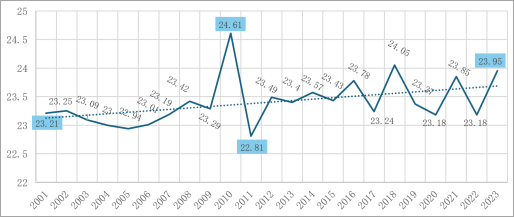
Figure 2 indicate the trend in the per capita GDP index over the period 2001–2023. The graph shows that the index follows a generally upward trend over the long term. The behavior of this index can be divided into three phases: The first period (2001–2010) was characterized by a clear upward trend, with per capita GDP rising from 10117 in 2001 to 13129 in 2010. This reflects the period of economic recovery and increased growth rates experienced by the Egyptian economy prior to 2011, driven by an increase in foreign direct investment and structural reforms at that time. The second period (2011–2014) represented a period of relative stability, during which per capita growth remained flat without significant increase as a result of political instability and economic slowdown during that time; per capita growth rose only slightly from 13028 in 2011 to 13,136 in 2014. The third period (2015–2023) marks a turning point, as the curve began a sharp and steady upward trajectory, driven by the implementation of a comprehensive economic reform program and the restoration of stability, which caused the pace of GDP growth to clearly outpace the rate of population growth.
A review of the above indicators reveals an upward trend in malnutrition rates in Egypt. However, understanding this decline in food security levels cannot be separated from the surrounding environmental challenges; here, climate change emerges as one of the key drivers of this phenomenon. To track this impact, the following section reviews temperature trends in Egypt during the same time period to assess the extent of this relationship.
Source: World Bank: https://climateknowledgeportal.worldbank.org/country/egypt/climate-data-historical

Download: Download full-size image

Figure 3. Annual Average temperature (°C).
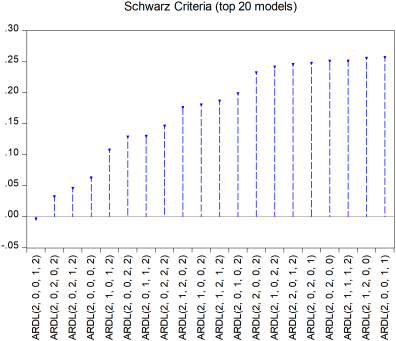
Figure 3, shows the average annual temperature in Egypt for the period 2001–2023, reveals an upward trend that clearly reflects the phenomenon of global warming and the impact of global climate change on the local climate; Statistical analysis of the index indicates that the baseline was in the first year (2001), when the mildest average temperature across the time series was recorded, at 23.21 °C, after which temperatures fluctuated, peaking at 24.61 °C in 2010 as a result of exceptional and prolonged heatwaves; in 2011, the temperature reached its lowest point at 22.81 °C. Focusing on the dynamics of change between the two ends of the series, the curve shows a marked rise in temperature towards the end of the period, with the annual average in the final year, 2023, rising to 23.95 °C, representing an absolute increase of 0.74 °C, which is equivalent to a 3.18% increase; this rapid rise over just a quarter of a century is a decisive indicator of the accelerating pace of global warming, with its consequent direct environmental and economic consequences.
3. Theoretical Framework and Literature Review
The emergence and development of the term “food security” in the international development literature can be traced back to the 1960s and 1970s, following a growing interest in food security at both the global and regional levels in the midst of the global oil crisis and the associated food crisis during the period (1972–1974), The famine that struck Africa during the period (1984–1985) and the growing importance of food aid in many countries also led to the proliferation of literature on food security .
The term “food security” first emerged in the mid-1970s, specifically at the World Food Conference held in Rome in 1974 under the auspices of the Food and Agriculture Organization of the United Nations (FAO), where the first definition of food security was presented as ''“Availability at all times of adequate world food supplies of basic foodstuffs to sustain a steady expansion of food consumption and to offset fluctuations in production and prices”. This definition reflects the dominant view at the time that hunger stems mainly from a lack of sufficient global food supplies, as well as constraints on food supplies. Thus, the definition focused primarily on the supply side, ignoring the issues of access to food and the equitable distribution of output. Production and prices fluctuations were considered important, which meant ensuring the measurement of production levels worldwide and trends in food prices .
However, research seeking to understand why famines occur in certain circumstances has shown that, even though food was widely available and food prices fell after the mid-1970s, this did not prevent a rise in rates of food insecurity across numerous developing nations . This unexpected paradox forced researchers to rethink what drives food insecurity from the ground up. By the early 1980s, a major conceptual shift took place. Economist Amartya Sen reframed the entire debate, arguing that food insecurity is fundamentally an issue of demand—meaning the poor simply cannot access food—rather than a national supply problem . As the discussion on food security evolved, the focus gradually shifted from the concept of food security as a national and international supply phenomenon to the issue of access to food at the household and individual levels. By 1983, (FAO) had incorporated into its analysis of food security the ability of individuals to obtain food, which led to the emergence of a new concept based on the balance of the food security equation by factoring in both supply and demand dynamics. This concept holds that ''“Ensuring that all people at all times have both physical and economic access to the basic food that they need” .
The World Bank published its report on poverty and hunger in various countries around the world in 1986, in which it emphasised the need to differentiate between chronic and temporary food insecurity. In the report, a distinction was drawn between chronic food insecurity, related to problems of persistent or structural poverty and low incomes, and temporary food insecurity, which refers to periods of heightened pressure brought on by natural disasters, economic breakdown or conflict .
In 1996, the World Food Summit provided a definition of food security, “food security” exists when all people, at all times, have physical and economic access to sufficient, safe, and nutritious food that meets their dietary needs and food preferences for an active and healthy life" . This definition thus emphasized the multidimensional nature of food security, which encompasses the following dimensions: a. Food availability; that is, the availability of sufficient quantities of food of adequate quality, whether through domestic production, imports, or food aid. b. food accessibility; this means that individuals have sufficient resources to obtain food of adequate nutritional value. c. Utilization of food; meaning a comprehensive dietary system. In addition to food, members of society must have access to clean water, improved sanitation, and adequate health care so that they can satisfy all their physiological needs. D. stability of food supplies; for an individual to enjoy food security, they must be able to obtain sufficient food whenever they wish and not be vulnerable to the possibility of losing access to food as a result of sudden shocks or cyclical events.
Recently, the moral and human rights dimensions of food security have come into focus. It is worth noting that the right to food is not a new concept; it was first recognized in the United Nations Declaration of Human Rights in 1948. In 1996, the formal recognition of the right to adequate food marked a significant achievement by the delegates of the World Food Summit, as reaffirmed “the right of everyone to have access to safe and nutritious food, consistent with the right to adequate food and the fundamental right of every person to be free from hunger” .
In May 2007, at the 33rd session of the World Food Summit, the Food and Agriculture Organization issued a statement reaffirming its vision of a world with food security . This vision is rooted in the definition of food security adopted by the World Food Summit in November 1996. The Food and Agriculture Organization emphasized that ‘food security depends more on socio-economic conditions than on agro-climatic conditions, and on access to food rather than its production or physical availability.’ It noted that to assess the potential impacts of climate change on food security, “it is not enough to assess the impacts on domestic production in food-insecure countries. One must also assess the impacts of climate change on foreign exchange earnings, determine the capacity of food-surplus countries to increase their commercial exports or food aid, and analyze how the incomes of the poor will be affected by climate change. This is included in its Global Agriculture Outlook for 2015–2030, which is considered its first published assessment of the impacts of climate change on food security .
Several studies have examined the impact of climate change on food production and availability. However, studies examining the impact of climate change on food access are few. Accordingly, this section provides a review of previous studies that analyze the relationship between climate variables and food access using a variety of analytical approaches and models.
Joel Smith et al. (UNDP) assessed how climate change might affect Egypt’s agricultural economy from 2030 to 2060. By applying a sea level rise (SLR) scenario, the study simulated modifications in crop yields and water availability. The findings indicate that by 2060, agricultural output could fall by 8% to 47%, while food prices may escalate by 16% to 68%. Additionally, farming-related employment is projected to contract by 39%, leading to agricultural welfare losses valued between 40 and 234 billion Egyptian pounds. Meanwhile, Hashem examined climate change’s influence on food security across Egypt utilizing the ARDL approach. The empirical evidence revealed that temperature exerts a positive and statistically significant impact on food access, driven by price inflation resulting from warmer conditions. Conversely, its positive effect on the prevalence of population undernutrition lacked statistical significance. Whereas Nassr et al. evaluated the prospective economic and social impacts of deteriorating weather conditions on economic growth and food security in Egypt, using the “International Model for the Analysis of Agricultural Commodity and Trade Policies” (IMPACT). The results show that losses in agricultural productivity resulting from climate change will lead to a rise in overall price level, subsequently causing a reduction in daily per capita food consumption (KCAL per person per day) by roughly -1.7% in 2030 and -3.8% by 2050. Ultimately, this will lead to an increase in hunger by an average of 0.017% during the period 2030–2050. Further, Ibrahim examined the extent to which climate change affects various dimensions of Egypt's food security through time-series modelling, specifically ARIMA and MLR. The empirical outcomes revealed revealed that climate variations exert a detrimental and statistically significant influence on both food access and availability. Driven by rising temperatures, crop yields are projected to contract by 2070, with wheat dropping up to 24.5%, maize by 29.1%, and rice by 6.1%. which in turn will cause rise in food prices from 13.5% to 18.9% by 2070.
Many studies investigations have highlighted the consequences of climate change on food access across the African continent. For instance, Wossen et al. evaluated what effect climate and price fluctuations have on household food security and income within Ghana and Ethiopia using an agent-based modelling approach to focus on adaptation and coping mechanisms. Their findings revealed that such variations detrimentally impact household welfare in both nations, leading to an average income reduction of approximately 5% in Ethiopia and 20% in Ghana. Similarly, Odongo et al. examined the relationship between environmental volatility and macroeconomic instability in Eastern and Southern African countries from 2001 to 2020. Utilizing a combination of quantitative descriptive analysis and error correction models (ECM) on monthly datasets. They found that rainfall fluctuations account for 65 per cent of food price volatility, with supply-side climate shocks significantly outweighing pressures from international markets. The study highlights that landlocked countries experience more severe inflation as a result of these shocks compared to coastal regions, underscoring the urgent need for sector-specific local strategies, such as solar-powered irrigation, to enhance economic resilience in sub-Saharan Africa. Meanwhile Oyelami et al. explored the relationship between institutional quality, climate change, and food security across 26 sub-Saharan African countries from 1996 to 2020. Utilizing Ordinary Least Squares (OLS) and Cross-Sectional Autoregressive Distributed Lag (CS-ARDL) techniques, they modelled food availability and accessibility dimensions. The practical results, using agricultural gross domestic product as a proxy for accessibility, indicated that while population growth and rainfall exert positive effects, temperature, inflation, and institutional quality negatively influence agricultural output. Furthermore, Mohamed et al. aimed to investigate the short- and long-run impacts of climate variability, food price inflation, and armed conflicts on global acute malnutrition in Somalia between 2015 and 2022. Applying dynamic ARDL simulations via STATA, in both the short and long term, food price inflation shows a positive association with global acute malnutrition, especially in conflict-prone areas and during periods of inflation. Furthermore, climatic variables—specifically temperature and rainfall—show non-significant positive associations with global acute malnutrition. Conversely, climatic factors like rainfall and temperature exhibited statistically nonsignificant positive associations with malnutrition in the short term.
Globally, several studies have examined the effect of high food prices on poverty in low-income countries, including the Ivanek and Martin study, which found that global increases in food prices tend to exacerbate poverty within low-income countries by reducing the purchasing power and increasing the living costs of poor families. The study relied on detailed household data from nine low-income countries to estimate these effects. The results showed that high food prices lead to increased poverty in low-income countries. The average estimated effects on national poverty rates (USD 1/ day) in the sample is an increase of 4.5%. It translates into a rise in poverty of 105 million people. While Heinen et al. analysed the relationship between extreme weather events and rising food prices. Using regression analysis on a monthly dataset covering the period from 2001 to 2012 across 15 Caribbean countries, the authors developed indices of damage caused by hurricanes and floods to assess the wider economic impacts. Their econometric framework revealed a strong causal relationship between severe weather shocks and increases in consumer food costs, with the negative effects persisting for between 3 and 6 months following such events. To clarify the resulting welfare losses, these price fluctuations were combined with demand elasticity and the probability of such events occurring in Jamaica. Ultimately, the researchers attributed these sustained price rises to severe disruptions in the agricultural supply chain and widespread damage to crops. Whereas, Yuksel et al. aimed to study climate shock’s impact on food prices in Turkey. They examined the role of climate change in determining food prices by using the causal effect of food prices on per capita food expenditure using the demand equation. The results showed a 5% increase in food prices in the region experiencing climate change, compared to other regions. However, they did not observe statistically significant variations in the effect of wealth on the consumption of other goods across regions.
4. Data and Methodology
4.1. Data Sources and Variables
This study uses annual time-series data for five variables covering the period 2001–2023 in Egypt, collected from the Food and Agriculture Organization of the United Nations (FAO) database, the World Bank (WB) database, the World Bank database's climate change Knowledge Portal (CCKP). More details on variable measurement and sources are given in Table 1 in the appendix.
The study model can be described as:
POUt = β0 + β1TEMt + β2LnF_CPIt + β3LnGDPt + β4PCFPt + εt(1)
Where:
POUt represents Prevalence of undernourishment (% of population) at time t.
TEMt represents Annual Average temperature at time t.
LnF_CPIt represents Log of food consumer price index at time t.
LnGDPt represents Log of GDP per capita (constant 2015 us$) at time t.
PCFPt represents per capita food Production at time t.
β0 is the constant term, β are the coefficients of independent variables, and εt represents the unexplained variables that affect on Prevalence of undernourishment (error term).
4.2. Methodology
To investigate the long-run co-integration and dynamic interactions among our variables, we utilize the Autoregressive Distributed Lag (ARDL) bounds approach developed by Pesaran et al. . This framework offers three distinct methodological advantages. First, it performs reliably with small sample sizes, making it ideal for our dataset of 23 observations. Second, unlike traditional techniques such as the Johansen procedure, the bounds test eliminates the need for preliminary unit root testing, functioning effectively whether the underlying regressors are integrated of order I(0), I(1), or mutually cointegrated. Third, it allows for the simultaneous estimation of both short- and long-term effects.
Within this ARDL framework, the short- and long-run relationships between food access and the independent variables are modelled using the following equations:
POUt=β0 +i=11β1POUt-1+i=01β2TEMt-1 +
i=01β3LnFCPIt-1+ i=01β4LnGDPt-1+ i=01β5PCFPt-1+ δ1POUt-1+
 δ2TEMt-1+ δ3LnF_CPIt-1+ δ4LnGDPt-1+ δ5PCFPt-1+ εt(2)
5. Results and Discussion
5.1. Unit Root Test
Before conducting the cointegration analysis, testing for unit roots is necessary to avoid biased inferences caused by non-stationary variable. To examine the unit root properties of the time-series data, we use Augmented Dickey Fuller Test (ADF test) . The alternative hypothesis of ADF indicates there is no unit root problem, while the null hypothesis implies that there is. Rejection of the null occurs if the calculated t-value exceeds the critical threshold. if it is lower, the reverse is true.
As detailed in Table 2, temperature (TEM) and the logarithm of GDP per capita (LnGDP) are stationary at level, I(0). Meanwhile, the prevalence of undernourishment (POU), the logarithm of food CPI, and per capita food production (PCFP) become stationary at first difference, I(1). Because all variables are integrated of order I(0) or I(1) with no higher-order integration, the ADF results justify the application of the ARDL regression.
Table 2. Results of ADF Test for Unit Roots.

Augmented Dickey Fuller Test

Variables

Level

First Difference

R

Intercept

Intercept and Trend

None

Intercept

Intercept and Trend

None

POU

1.63743

-2.23358

1.94535

-1.48692

-4.31436***

-1.09829

I(1)

TEM

-5.33395***

-6.629182***

0.49787

-

-

-

I(0)

LnF_CPI

1.74065

-2.999377

3.76279

-2.89986**

-3.36113*

0.02308

I(1)

LnGDP

-0.88963

-3.95809**

2.18706

-

-

-

I(0)

PCFP

-2.12310

-2.57225

0.49893

-4.36488***

-4.18671***

-4.4668***

I(1)

*, **, *** indicate 10%, 5%, and 1% level of significance respectively.
5.2. Lag Selection Criteria
This is performed before the bound test for the ARDL model to verify whether cointegration exists between the variables; it is important to identify the best ARDL model, as this involves selecting the optimum lag length for dependent variable and independent variables. The determination of lags is of paramount importance for obtaining Gaussian error terms that are not autocorrelated. The lag lengths are set using information criterion tests such as the Hannan–Quinn criterion, the Schwarz criterion and the Akaike Information Criterion. Due to the discrepancy between the Akaike Information Criterion (AIC) and the Schwarz Information Criterion (SIC) in determining the optimal model structure and lag length, this study relies on the Schwarz Information Criterion (SIC) to specify the final model parameters. The best ARDL model, with the minimum SC value, was: ARDL (2, 0, 0, 1, 2). The selection rests on the fact that the SIC outperforms the AIC in terms of the 'consistency' property. In contrast, the AIC is often criticized for its tendency toward lag length overestimation, which introduces redundant parameters that consume degrees of freedom and create multicollinearity issues.
Source: Authors’ Estimations and Eviews Plotting

Download: Download full-size image

Figure 4. Schwarz criterion (Top 20 Models).
5.3. F-Bounds Test
Based on Fosu and Magnus , the ARDL method begins with an F-bounds test to verify the presence of long-run relationships. Comparing the F-statistic against the critical values that given in Pesaran et al. leads to three possible outcomes: a statistic above the upper bound rejects the null hypothesis of no cointegration, while one below the lower bound fails to reject it. Any value falling between these two thresholds remains inconclusive.
Table 3. Results of the F-Bounds.

F-statistic

Significance level

I(0)

I(1)

10%

1.9

3.01

5.828517

5%

2.26

3.48

2.5%

2.62

3.9

1%

3.07

4.44

Source: Authors’ calculating (Eviews)
Table 3 illustrates the results of the F-bounds test. The F-statistic value is 5.828517 which is higher than the the critical value for the upper bound at 1% significance level. The results of Bounds test successfully rejected the null hypothesis of no cointegration.
5.4. Long Run Estimation
Once cointegration in the long run between the variables has been confirmed via the ARDL bound test, the long-run elasticity coefficient elasticities for these variables can be estimated. Table 4 displays the coefficients of climate and non-climate variables that effect on Prevalence of undernourishment of Pop in Egypt in the long run.
Table 4. Long-run Relationships.

Variables

Coefficient

t-Statistic

TEM

0.401303

3.599137***

LnF_CPI

0.922497

14.70929***

LnGDP

-0.491167

-1.824414*

PCFP

-0.037839

-3.249856***

*, **, *** indicate 10%, 5%, and 1% level of significance respectively.
Source: Authors’ calculating (Eviews)
As shown in Table 4, Temperature and Food consumer price are positively and significantly associated with the prevalence of undernourishment as a percentage of the entire population. Whereas GDP per capita and per capita food production negatively effect on Prevalence of undernourishment. Prevalence of undernourishment will increase by 0.40% and 0.90% if the temperature increases by one degree Celsius 5% significance level, and Food consumer price increase by one percent at 1% significance level respectively. conversely 1% increase in GDP per capita would lead to a 0.49% reduction in prevalence of malnutrition among the population at 10% significance level. 0.49% at 10% significance level. Also, 1 percent increase of per capita food production will cause 0.03% decrease in Prevalence of undernourishment at 1% significance level.
5.5. Short Run Estimates and Error Correction Regression
Table 5 shows the short run dynamics coefficients from the estimated ARDL model.
Table 5. Short Run and Error Correction Regression Results.

Independent Variables

Coefficient

t-Statistic

D(POU(-1))

1.306311

11.20655***

D(PCFP)

0.036591

3.390228***

D(PCFP(-1))

0.030760

2.997092***

D(LnGDP)

6.465097

4.433138***

CointEq(-1)*

-0.576774

-6.233521***

*, **, *** indicate 10%, 5%, and 1% level of significance respectively.
Source: Authors’ calculating (EViews)
As presented in Table 5, the coefficients of Error Correction Term (ECT) is -0.576774. since it is a negative sign, its absolute value is strictly less than one and it is significant at 1% significance level. It implies that about 57.6% of any short-run deviations from the long-run equilibrium are corrected within one period.
5.6. Diagnostics Tests
Diagnostic tests were performed to ensure the robustness of the results, and confirm that the model possesses the required econometric properties and exhibited the best fit for an ARDL model, it is also suitable for reliable interpretation, Specifically, the Breusch-Godfrey serial (LM) test is utilized to detect serial correlation, while the Breusch-Pagan-Godfrey test is applied to assess heteroscedasticity. Additionally, the Jarque-Bera test evaluated the normality of the residual distribution, and the Ramsey RESET test is employed to verify the correctness of the model specification.
Table 6. Diagnostics Tests Results.

Tests

Test Statistics

Breusch-Godfrey serial Correlation LM

F-statistic

2.825206

Prob. F (1,11)

0.1209

Heteroskedasticity Test: Breusch-Pagan-Godfrey

F-statistic

1.173754

Prob. F (11,9)

0.3944

Normality Test

Jarque-Bera

1.768068

Probability

0.413113

Ramsey Reset

F-statistic

1.656376

Probability

0.2245

Source: Authors’ calculating (EViews)
To ensure the reliability of the statistical inference, The Breusch-Godfrey Serial Correlation LM test is employed to evaluate the residuals for potential serial autocorrelation . Table 6 shows that the F-statistic p-value equals 0.1209. Given that the p-value of the F-statistic is higher than 5%, the null hypothesis of no serial correlation cannot be rejected, confirming the absence of autocorrelation within the model.
The presence of heteroskedasticity is evaluated using the Breusch-Pagan-Godfrey test. Table 6 shows that the F-statistic p-value equals 0.3944. Since the p-value exceeds the 5% significance level, we cannot reject the null hypothesis, indicating that the residuals are free from heteroskedasticity.
As Brooks pointed out, deviations from the normal distribution may distort statistical inferences, particularly confidence intervals and significance tests for coefficient estimates. To check the extent to which the residuals follow a normal distribution, the Jarque–Bera test is applied under the null hypothesis: If the resulting p-value exceeds the 5% threshold, the null hypothesis cannot be rejected, confirming that the residuals follow a normal distribution. According to table 6, the p-value of Jarque-Bera tests is 0.413113, thus the residuals are normally distributed.
An inefficient estimation of a standard economic model may result from an error in the specification of the variables. To check for specification errors in standard economic models, Ramsey devised the RESET tool, which identifies both missing variables and incorrect functional forms. Table 6 shows that the p-value for the F-statistic is 0.2245, which is greater than 5%; therefore, we cannot reject the null hypothesis that there are no omitted variables in the model, and thus there is no error in variable selection .
5.7. Stability
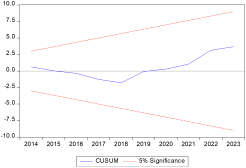
To verify the accuracy and stability of our findings regarding the estimated parameters for both the long-run and short-run of the ARDL (2, 0, 0, 1) model, with error correction, we employed the Cumulative Sum (CUSUM) and Cumulative Sum of Squares (CUSUM of squares) tests, as proposed by Brown et al. and Pesaran and Pesaran . The CUSUM and CUSUMQ statistics are updated frequently and plotted against the breakpoints. When the plotted points for the CUSUM and CUSUMQ statistics remain within the critical limits at a 5% significance level, the null hypotheses for all coefficients in the given regression are stable and cannot be rejected.
Figures 5 and 6 show that the CUSUM and CUSUMQ of squares statistic remain within the critical limits at a 5% significance level. We can therefore conclude that the coefficients in our ARDL models are stable. Consequently, the null hypothesis, which states that all coefficients are stable, cannot be rejected.
Figure 5. Plot of Cumulative Sum of Recursive Residuals.
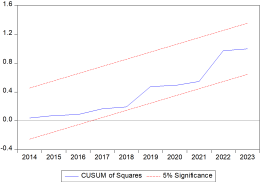
Figure 6. Plot of Cumulative Sum of Squares of Recursive Residuals.

6. Conclusion
This study was conducted with the aim of empirically examining the influence of climate change on food accessibility in Egypt from 2001 to 2023 by using the autoregressive distributed lag (ARDL) approach cointegration in conjunction with ECM techniques to identify long-run and short-run effects. The analytical framework specifies the "Prevalence of Undernourishment" indicator as the dependent variable, driven by four explanatory variables representing climate shocks, economic drivers, and supply-side indicator: Temperature, Food Consumer Price Index (Food CPI), GDP per capita, and per capita Food Production. The empirical findings indicate a significant negative impact of climate change on food access, with temperature having a positive effect on the prevalence of malnutrition – as temperature-related shocks negatively affect food supply and lead to higher domestic food price inflation, which in turn leads to higher rates of undernutrition among the population. Food price inflation has a negative impact on access to food, as these sharp price increases lead to a contraction in real income and higher rates of malnutrition during climate shocks. With regard to GDP per capita and its positive impact on access to food, this demonstrates that purchasing power and income act as fundamental structural buffers protecting Egyptian households from sharp rises in food price inflation. As for per capita food production, this has an adverse effect on malnutrition rates. The study recommends accelerating climate variability adaptation strategies to boost per capita food production, alongside curbing food price inflation and expanding social safety nets to ensure financial resilience.
Abbreviations

ADF

Augmented Dickey-Fuller

ARDL

Autoregressive Distributed Lag

FAO

Food and Agriculture Organization

IPCC

Intergovernmental Panel on Climate Change

SDGs

Sustainable Development Goals

WFI

World Food Programme

Author Contributions
Khaled Abdel Wahab Elbagory: Conceptualization, Formal Analysis, Methodology, Project administration, Supervision, Validation, Visualization
Maha Hussein Mohamed: Conceptualization, Data curation, Investigation, Methodology, Resources, Software, Writing – original draft, Writing – review & editing
Ali Mohamed Ali Mahmoud: Conceptualization, Formal Analysis, Methodology, Project administration, Supervision, Validation, Visualization
Conflicts of Interest
The authors declare that they have no conflict of interest.
Appendix
Table 1. Variables Definition.

Abbreviation

Variable and Measurement

Source of the data

POU

Prevalence of undernourishment (% of population)

FAOSTAT Database (Food and Agriculture Organization) (FAO) https://www.fao.org/faostat/en/#data/FS

TEM

Annual Average temperature (°C)

World Bank https://climateknowledgeportal.worldbank.org/country/egypt/climate-data-historical

F_CPI

Food, Consumer Price index

FAOSTAT Database (FAO) https://www.fao.org/faostat/en/#data/CP

GDP

GDP per capita (constant 2015 US$)

World Bank https://data.worldbank.org/indicator/NY.GDP.PCAP.KD?end=2023&locations=EG&start=2001

PCFP

Per capita food production

World Bank https://data.worldbank.org/indicator/NY.GDP.PCAP.KD.ZG?end=2023&locations=EG&start=2001

References
[1] FAO, IFAD, UNICEF, WFP and WHO. (2025). The State of Food Security and Nutrition in the World 2025: Addressing high food price inflation for food security and nutrition. Rome, FAO.
[2] FAO, IFAD, UNICEF, WFP and WHO. (2024). The State of Food Security and Nutrition in the World 2024. Rome, FAO.
[3] IPCC. (2023). Climate Change 2023: Synthesis Report, Summary for Policymakers. Contribution of Working Groups I, II and III to the Sixth Assessment Report of the Intergovernmental Panel on Climate Change [Core Writing Team, H. Lee and J. Romero (eds.)]. IPCC, Geneva, Switzerland.‏
[4] Thomsen, A. & Metz, M. 1998. Implications of economic policy for food security: A training manual. Rome. FAO and the German Agency for Technical Cooperation (GTZ)
[5] FAO. (2008). Climate change and food security: a framework document. FAO Rome,
[6] Fahim, M. A., Hassanein, M. K., Khalil, A. A., & Abou Hadid, A. F. (2013). Climate change adaptation needs for food security in Egypt. Nature and Science, 11(12), 68-74.‏
[7] Arab Republic of Egypt. (2022). Egypt’s first updated nationally determined contribution. United Nations Framework Convention on Climate Change (UNFCCC).‏
[8] IPCC. (2007). Climate Change 2007: Impacts, Adaptation and Vulnerability. Contribution of Working Group II to the Fourth Assessment Report of the Intergovernmental Panel on Climate Change, M. L. Parry, O. F. Canziani, J. P. Palutikof, P. J. van der Linden and C. E. Hanson, Eds., Cambridge University Press, Cambridge, UK, 976pp.
[9] IFPRI. (2023). Food price shocks and diets among poor households in Egypt. International Food Policy Research Institute, Cairo Office.
[10] FAO. (2025). GIEWS Country Brief: The Arab Republic of Egypt. Food and Agriculture Organization of the United Nations, Rome.
[11] USDA. (2025). Egypt: Grain and Feed Update. Foreign Agricultural Service, U.S. Department of Agriculture.
[12] Al-Shawarby, S., & Selim, H. (2013). Are international food price spikes the source of Egypt’s high inflation?. In Financial Integration: A Focus on the Mediterranean Region (pp. 61-83). Berlin, Heidelberg: Springer Berlin Heidelberg.‏
[13] IDSC. (2024). Malnutrition and Food Waste Syndrome in Egypt. Egyptian Cabinet Information and Decision Support Center.
[14] Mazloum, A., Rizk, A., Muhab, N., & Asal, Z. (2021). Addressing Food Insecurity in Egypt: Towards Sustaining Food Access for All.
[15] Hashem, E. A. (2020). The Impacts of Climate Change on Food Security–Case Study: Egypt. Journal of Economics and Business, 3(2), 868-884.
[16] WFI. (2013). Tackling Egypt’s rising food insecurity in a time of transition.‏
[17] Maxwell, S. (1996). Food security: a post-modern perspective. Food policy, 21(2), 155-170.‏
[18] FAO. (1974). World Food and Agriculture Situation. Rome.
[19] Sijm, J. (1997). Food Security and Policy Interventions in Sub-Saharan Africa. Thela Publishers, Prinseneiland, Amsterdam, The Netherlands.
[20] Sen, A. (1981). Poverty and Famines: An Essay on Entitlement and Deprivation. Oxford, UK, Oxford University Press.
[21] FAO. (1983). World Food Security: a Reappraisal of the Concepts and Approaches. Director Generals Report, Rome.
[22] World Bank. (1986). Poverty and Hunger: Issues and Options for Food Security in Developing Countries. Washington DC.
[23] FAO. (1996). Declaration on World Food Security and World Food Summit Plan of Action. World food Summit 13-17 November, Rome.
[24] United Nations General Assembly (UNGA). (1948). Universal Declaration of Human Rights. Resolution adopted by the General Assembly on 10 December 1948, General Assembly resolution 217 A. Paris.
[25] FAO. 2007. National Programmes for Food Security: FAO’s vision of a world without hunger. Rome.
[26] FAO. (2003). World agriculture: Toward 2015/2030. Rome, Earthscan, Chapter 13, p365-366.
[27] UNDP - United Nations Development Programme, 2013. Potential Impacts of Climate Change on the Egyptian Economy, Egypt, pp. 13-35.
[28] Nassr, S. Z., Ahmed, Y. N., Siam, G. M., Soliman, N. Y., & Sabbah, S. H. (2021). Analysis of climate change effects on food security in Egypt using IMPACT model. Egyptian Journal of Agricultural Economy, 31(3), 1002-1011.
[29] Ibrahim, E. A. (2023). The impact of climate change on food security dimensions in Egypt by 2070.‏
[30] Wossen, T., Berger, T., Haile, M. G., & Troost, C. (2018). Impacts of climate variability and food price volatility on household income and food security of farm households in East and West Africa. Agricultural systems, 163, 7-15.‏
[31] Odongo, M. T., Misati, R. N., Kamau, A. W., & Kisingu, K. N. (2022). Climate change and inflation in Eastern and Southern Africa. Sustainability, 14(22), 14764.‏
[32] Oyelami, L. O., Edewor, S. E., Folorunso, J. O., & Abasilim, U. D. (2023). Climate change, institutional quality and food security: Sub-Saharan African experiences. Scientific African, 20, e01727.‏
[33] Mohamed, J., Abdi, M. J., Mohamed, A. I., Muhumed, M. A., Abdeeq, B. A., Abdi, A. A.,... & Ali, D. A. (2024). Predicting the short and long term effects of food price inflation, armed conflicts, and climate variability on global acute malnutrition in Somalia. Journal of Health, Population and Nutrition, 43(1), 68.‏
[34] Ivanic, M., & Martin, W. (2008). Implications of higher global food prices for poverty in low‐income countries 1. Agricultural economics, 39, 405-416.‏
[35] Heinen, A., Khadan, J., & Strobl, E. (2019). The price impact of extreme weather in developing countries. The Economic Journal, 129(619), 1327-1342.‏
[36] Yüksel, E., İkizler, H., & Mutlu, A. E. (2021, December). Potential impact of climate change on food consumption through price channel: case for Turkey. Economic Research Forum (ERF).‏
[37] Pesaran, M. H., Shin, Y., & Smith, R. J. (2001). Bounds Testing Approach to the Analysis of Level Relationships. Journal of Applied Econometrics, 16(3), 289-326.
[38] Dickey, D. A. and Fuller, W. A. (1981). Likelihood ratio statistics for autoregressive time series with a unit root. Econometrica: Journal of the Econometric Society, 1057-1072.
[39] Fosu, O. A. E., & Magnus, F. J. (2006). Bounds testing approach to cointegration: An examination of foreign direct investment trade and growth relationships. American Journal of Applied Sciences, 3(11), 2079–2085
[40] Godfrey, L. G. (1978). Testing Against General Autoregressive and Moving Average Error Models when the Regressors Include Lagged Dependent Variables. Econometrica, 46(6), 1293-1301.
[41] Brooks, C. (2014). Introductory Econometrics for Finance. New York: Cambridge University Press.
[42] Ramsey, J. B. (1969). Tests for Specification Errors in Classical Linear Least-Squares Regression Analysis. Journal of the Royal Statistical Society, Series B (Methodological), 350-371.
[43] Brown, R. L., Durbin, J. and Evans, J. M. (1975). Techniques for testing the constancy of regression relationships over time. Journal of the Royal Statistical Society Series B: Statistical Methodology, 37(2), 149-163.
[44] Pesaran, M. H. and Pesaran, B. (1997). Working with Microfit 4.0: Interactive Econometric Analysis.
Cite This Article
  • APA Style

    Elbagory, K. A. W., Mohamed, M. H., Mahmoud, A. M. A. (2026). The Impact of Climate Change on Food Accessibility in Egypt: An Empirical Analysis of Prevalence of Undernourishment. International Journal of Nutrition and Food Sciences, 15(5), 178-190. https://doi.org/10.11648/j.ijnfs.20261505.11

    Copy | Download

    ACS Style

    Elbagory, K. A. W.; Mohamed, M. H.; Mahmoud, A. M. A. The Impact of Climate Change on Food Accessibility in Egypt: An Empirical Analysis of Prevalence of Undernourishment. Int. J. Nutr. Food Sci. 2026, 15(5), 178-190. doi: 10.11648/j.ijnfs.20261505.11

    Copy | Download

    AMA Style

    Elbagory KAW, Mohamed MH, Mahmoud AMA. The Impact of Climate Change on Food Accessibility in Egypt: An Empirical Analysis of Prevalence of Undernourishment. Int J Nutr Food Sci. 2026;15(5):178-190. doi: 10.11648/j.ijnfs.20261505.11

    Copy | Download

  • @article{10.11648/j.ijnfs.20261505.11,
      author = {Khaled Abdel Wahab Elbagory and Maha Hussein Mohamed and Ali Mohamed Ali Mahmoud},
      title = {The Impact of Climate Change on Food Accessibility in Egypt: An Empirical Analysis of Prevalence of Undernourishment},
      journal = {International Journal of Nutrition and Food Sciences},
      volume = {15},
      number = {5},
      pages = {178-190},
      doi = {10.11648/j.ijnfs.20261505.11},
      url = {https://doi.org/10.11648/j.ijnfs.20261505.11},
      eprint = {https://article.sciencepublishinggroup.com/pdf/10.11648.j.ijnfs.20261505.11},
      abstract = {Climate change is negatively affecting food systems as a whole, as weather events are becoming more frequent and severe, which will pose a challenge to food production and may threaten the world’s people's ability to access and afford healthy diets, particularly in lower-income countries with higher rates of hunger and poverty. Inadequate diets will exacerbate the harm caused to people’s health and lead to higher rates of malnutrition among the population. In this study, we aim to examine the impact of climate change on food accessibility in Egypt over the period 2001–2023. We adopted the autoregressive distributed lag (ARDL) approach to trace long-run and short-run effects. The empirical results indicate a significant negative effect of climate change on food access, with temperature having a positive effect on the prevalence of malnutrition—as temperature-related shocks negatively affect food supply and lead to higher domestic food prices, which in turn limit people’s ability to purchase healthy and adequate food, thereby increasing malnutrition rates among the population. Food price inflation negatively impacts access to food, as these sharp price increases lead to a contraction in real income and higher rates of malnutrition during climate shocks. With regard to gross domestic product per capita and its positive impact on access to food, this demonstrates that purchasing power and income act as fundamental structural buffers protecting Egyptians households from sharp rises in food price inflation. As for per capita food production, this has a negative impact on malnutrition rates.},
     year = {2026}
    }
    

    Copy | Download

  • TY  - JOUR
    T1  - The Impact of Climate Change on Food Accessibility in Egypt: An Empirical Analysis of Prevalence of Undernourishment
    AU  - Khaled Abdel Wahab Elbagory
    AU  - Maha Hussein Mohamed
    AU  - Ali Mohamed Ali Mahmoud
    Y1  - 2026/09/09
    PY  - 2026
    N1  - https://doi.org/10.11648/j.ijnfs.20261505.11
    DO  - 10.11648/j.ijnfs.20261505.11
    T2  - International Journal of Nutrition and Food Sciences
    JF  - International Journal of Nutrition and Food Sciences
    JO  - International Journal of Nutrition and Food Sciences
    SP  - 178
    EP  - 190
    PB  - Science Publishing Group
    SN  - 2327-2716
    UR  - https://doi.org/10.11648/j.ijnfs.20261505.11
    AB  - Climate change is negatively affecting food systems as a whole, as weather events are becoming more frequent and severe, which will pose a challenge to food production and may threaten the world’s people's ability to access and afford healthy diets, particularly in lower-income countries with higher rates of hunger and poverty. Inadequate diets will exacerbate the harm caused to people’s health and lead to higher rates of malnutrition among the population. In this study, we aim to examine the impact of climate change on food accessibility in Egypt over the period 2001–2023. We adopted the autoregressive distributed lag (ARDL) approach to trace long-run and short-run effects. The empirical results indicate a significant negative effect of climate change on food access, with temperature having a positive effect on the prevalence of malnutrition—as temperature-related shocks negatively affect food supply and lead to higher domestic food prices, which in turn limit people’s ability to purchase healthy and adequate food, thereby increasing malnutrition rates among the population. Food price inflation negatively impacts access to food, as these sharp price increases lead to a contraction in real income and higher rates of malnutrition during climate shocks. With regard to gross domestic product per capita and its positive impact on access to food, this demonstrates that purchasing power and income act as fundamental structural buffers protecting Egyptians households from sharp rises in food price inflation. As for per capita food production, this has a negative impact on malnutrition rates.
    VL  - 15
    IS  - 5
    ER  - 

    Copy | Download

Author Information